‘Resilient’ is the most common word used to describe the Australian consumer since the interest rate hiking cycle begun two years ago. The Australian consumer has endured the rate hiking cycle with surprisingly good health, with several underlying factors at play.

Firstly, our labour market has been remarkably strong, with unemployment near record lows and labour participation rates at near record highs. Many people have upgraded their jobs, seeing the quit rate (officially known as the ‘job mobility’) at 12-year highs and the retrenchment rate at all-time lows.
Consumers have also been supported by the large savings buffer built during the pandemic, with multiple stimulus packages handed out at a time when spending was curtailed by lockdowns. Our savings rate spiked to an unprecedented 23.6% – the highest level since records began in 1959 and multiples of the pre-COVID average of 6.5%. We estimate that Australian households built up $270 billion in excess savings at their peak, equivalent to $10,300 per person.
During this period, many mortgage holders locked in ultra-low fixed rates, which has held them in good stead. In fact, until January 2022, the proportion of fixed rate mortgages almost doubled, nearing 40% of the total mortgages outstanding, as borrowers took advantage of cash rates near zero.
Migration has also helped to drive consumer spending. Pent up demand following the re-opening of our borders after COVID saw net migration hit a record high in 2023, with 518,000 immigrants arriving onto Australian shores, which equates to 2% of the Australian population.
And finally, our post-lockdown ‘revenge spending’ seems to continue unabated. Spending in services, including restaurants and travel – the sticky inflation – has been the hardest to impact. But how much longer can consumers withstand the squeeze?
Resilient no more
From where I stand, not for much longer.
The labour market is weakening. In May 2024, the unemployment rate rose to 4.0% from a low of 3.5% and while still low by historic standards, leading indicators point to further weakness.
Growth in job advertisements declined in February last year, with the pace of decline reaching 17.5% by November 2023. Historically, when advertising for jobs has declined at this rate, total employment growth has fallen to zero or below.
And while according to headline figures, employment remains robust, there is more behind these numbers. Anecdotally, many companies burnt by labour shortages post-COVID are reluctant to let employees go. This labour ‘hoarding’ can only be upheld if business conditions don’t worsen. But Telstra’s recent announcement to slash 2,800 employees nationally serves as a stark reminder as to how quickly things can change.
Chart 1: Growth in job advertisements has fallen
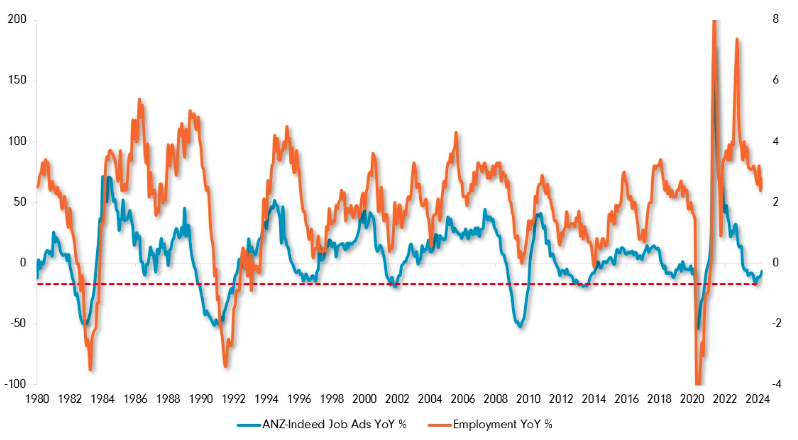
Source: ANZ-Indeed, ABS, Bloomberg, Fidelity International, June 2024.
The savings buffers have been drawn down by ~$70 billion since the peak, which leaves around $200 billion in excess savings. However, what is more relevant is the distribution of what’s left in the economy.
AMP analysis indicates that the bottom 40% of households by income have already exhausted their excess savings, while high income earners are sitting on a significant surplus.1 This is an important distinction as we know higher income earners have less propensity to spend their savings.
Likewise, CBA data shows only people over 55 years are still seeing their savings balances grow. As cost-of-living pressures continue to rise, consumers under 55 are seeing deposit balances decline, with the pace of the decline increasing for younger age groups.
Chart 2: Savings balances by age cohort
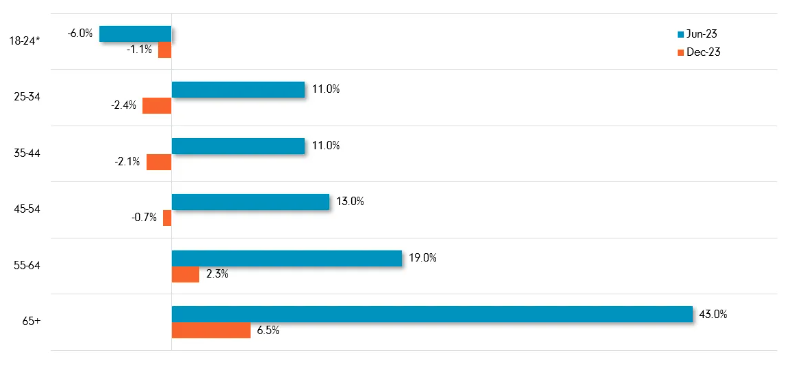
Source: CBA, Fidelity International, June 2024.
*June 2023 data is for 18-24 year olds. December 2023 data is for 20-24 year olds
So while the fabled ‘mortgage cliff’ – the cliff the economy was meant to fall off last year – didn’t materialise, the risk of a slower slide down the mortgage hill remains.
And the longer interest rates remain high, cost-of-living pressures eat further into household budgets. The trend in excess mortgage payments data supports this. Household disposable income used for excess mortgage payments has plummeted by more than 60% with the rise in interest rates, a trend that continues to worsen.
It is also clear that the likelihood of multiple interest rate cuts this year is low. Inflation is stickier than expected, especially in core, essential service categories such as housing, transport, education, insurance and financial services. These categories represent almost half of the Consumer Price Index basket and are seeing high, and in some cases, rising levels of inflation.
Finally, immigration is also being curtailed. Both the Government and the Opposition have pledged to lower the intake given the strains it has placed on the housing sector. The May budget forecasts a halving in net migration with the Opposition pledging to lower it further.
Prepare for weakness ahead
Delve deeper into the headline retail sales figures further unveils a weakening consumer.
The ‘Real retail sales’ measure removes the impact of price changes and gives a better indication of volumes and is arguably a better measure in periods of high inflation. Real retail sales turned negative in February 2023 and has continued to decline 3-5% year on year.
Furthermore, real retail sales per capita, which also removes the impact of population growth, fell in November 2022 and has continued to decline around 5-7% year on year.
While consumer resilience has been strong until now, the tide has changed. I foresee a period of sustained consumer weakness that could last years.
Indeed, this was what we experienced post GFC. Whilst real retail sales declined sharply during the recession in 2008, it was relatively short-lived. The prolonged period of weakness was between 2010-12, long after the recession ended.
Chart 3: Trends in household spending
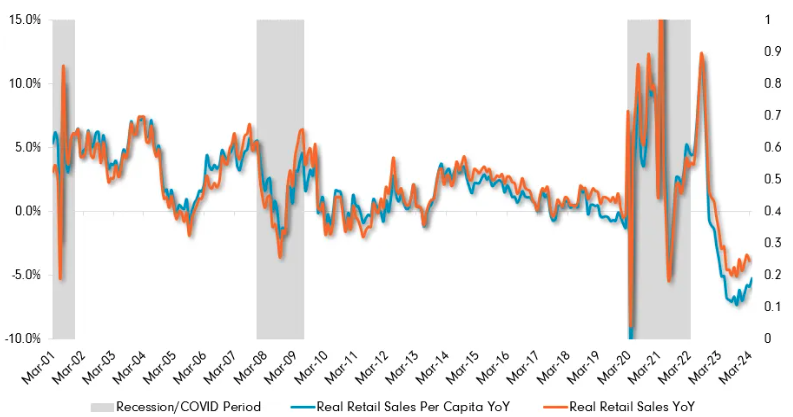
Source: ABS, Bloomberg, Fidelity international, June 2024.
Invest with caution
Over the past 12 months, many consumer discretionary stocks have benefited from ‘better than expected’ earnings and have risen to new highs. But with the headwinds this sector is facing, I see better risk/reward opportunities elsewhere.
Some consumer staple stocks, less discretionary by nature, have de-rated recently and are benefiting from margin improvements as their cost base decreases. I see other attractive opportunities also in the technology and insurance sectors, where companies have stronger pricing power which can enable more solid earnings growth.
Australian consumers have been resilient, but time is running out.
Source: 1. Five lessons learned in 2023 – AMP
Source:
Reproduced with permission of Fidelity Australia. This article was originally published at https://www.fidelity.com.au/insights/investment-articles/a-pullback-in-australian-consumer-spending-could-last-years/
This document has been prepared without taking into account your objectives, financial situation or needs. You should consider these matters before acting on the information. You should also consider the relevant Product Disclosure Statements (“PDS”) for any Fidelity Australia product mentioned in this document before making any decision about whether to acquire the product. The PDS can be obtained by contacting Fidelity Australia on 1800 119 270 or by downloading it from our website at www.fidelity.com.au. This document may include general commentary on market activity, sector trends or other broad-based economic or political conditions that should not be taken as investment advice. Information stated herein about specific securities is subject to change. Any reference to specific securities should not be taken as a recommendation to buy, sell or hold these securities. While the information contained in this document has been prepared with reasonable care, no responsibility or liability is accepted for any errors or omissions or misstatements however caused. This document is intended as general information only. The document may not be reproduced or transmitted without prior written permission of Fidelity Australia. The issuer of Fidelity Australia’s managed investment schemes is FIL Responsible Entity (Australia) Limited ABN 33 148 059 009. Reference to ($) are in Australian dollars unless stated otherwise.
© 2023. FIL Responsible Entity (Australia) Limited.
Important:
This provides general information and hasn’t taken your circumstances into account. It’s important to consider your particular circumstances before deciding what’s right for you. Any information provided by the author detailed above is separate and external to our business and our Licensee. Neither our business nor our Licensee takes any responsibility for any action or any service provided by the author. Any links have been provided with permission for information purposes only and will take you to external websites, which are not connected to our company in any way. Note: Our company does not endorse and is not responsible for the accuracy of the contents/information contained within the linked site(s) accessible from this page.